Whenever the concept of standard deviation is mentioned, I see a lot of eyes rolling. But the good news is that this useful calculation is really easy, especially when done in a spreadsheet program.
What is it and why would you want to use it?
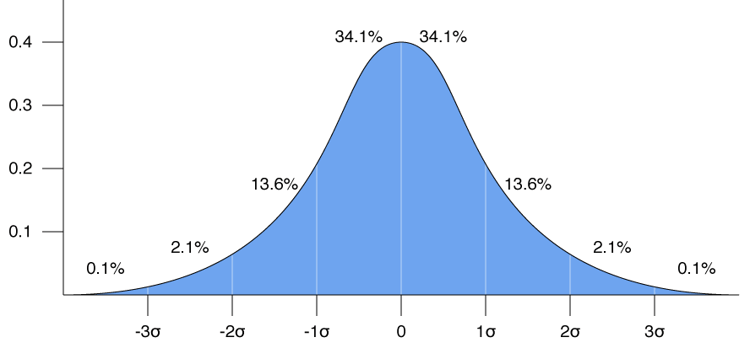
By definition, it is a measure that is used to quantify the amount of variation or dispersion in a set of data values. Really? What does that mean? If you have a bunch of numbers that you want to analyze, it is one of the tools that will help you to understand how widely the data points spread from the top to the bottom. It also tells you how tightly they cluster around the average. The distribution can be visualized on a graph that has the appearance of a bell. It looks a lot like the distribution that teachers use in school to give most of the students a C, a smaller number a B or D and very few an A or F.

The calculation provides a single number that identifies the distribution pattern in the following manner:
- Approximately 68% of all of the data points will be within 1 standard deviation either above or below the mean (or average). These would be the students who would earn a C grade – including C+ and C-.
- Approximately 95% of all the data points will be within 2 standard deviations from the mean. The 13.6% shown in the sections above would be the students receiving a B or D.
- Nearly all the data points will be within 3 standard deviations from the mean. This is represented in the graph by the 2.1% on either end that would be the students who earn an A or F.
In a contact center, you would want to use this type of analysis to study a single population at a time. For example, you could study one call type, one line of business, just new hire agents versus all combined.
Let’s say you have the AHT statistics for every agent in your center that takes a specific type of call. You can calculate the average handling time (AHT) and that tells you part of what you want to know, especially for workforce planning calculations. But it is also useful to know how wide the spread is.
You could just look for the lowest number and the highest. But that won’t help you to determine whether the distribution of the AHTs is strongly clustered around the average or more evenly spread out from lowest to highest. That is where standard deviation comes into play. It is single number that provides a clear picture of that distribution.
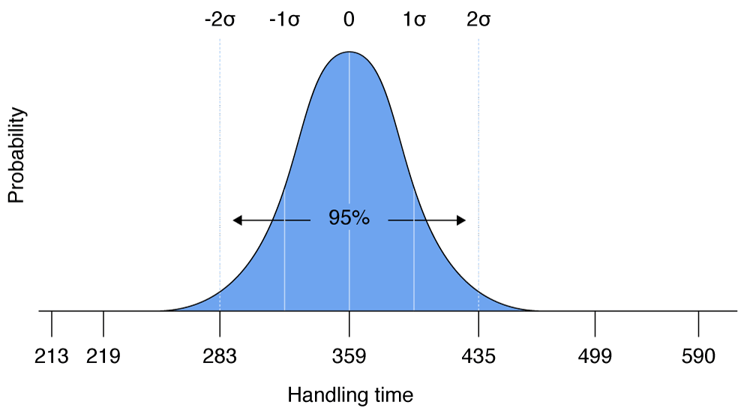
Assume your AHT data provides an average of 359 seconds per call for all of the agents. The lowest number in the group is 213 seconds while the highest is 590 seconds. You see already that the spread is pretty wide. But what we don’t know yet is whether these high/low numbers are real outliers or whether a lot of your agents have AHTs that are very high or low.
Calculating the standard deviation for this data set results in a number of 38. That means that 68% of our agents have AHTs that are only 38 seconds higher or lower than the average. In this case, that is 321 to 397. If we add another 38 seconds to these results to pick up 95% of the data points, we find that very few of our agents have AHTs shorter than 283 or higher than 435. So the 213 low and 590 high are real outliers and very few agents have results like this.

For AHT in the 5% on either end of the scale, further investigation is needed. Agents may have a technical problem. Another more likely scenario is that they may need 1:1 coaching to help them handle calls in the proper way.
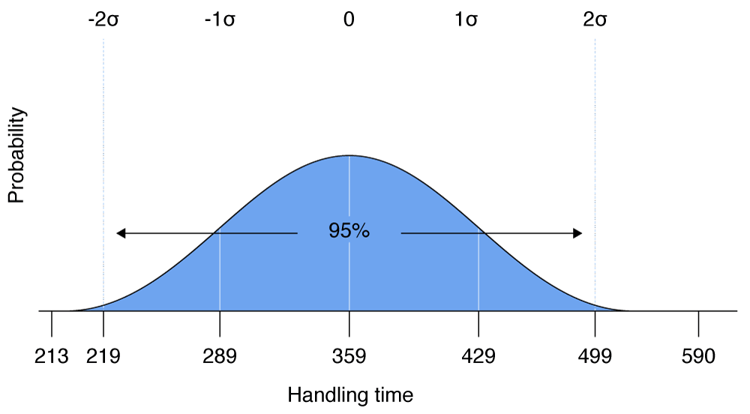
But let’s look at another set of AHTs with an average of 359 seconds, with a low of 213 and a high of 590. This time when we calculate the standard deviation, it comes out to 70.
Now, you add 70 and subtract 70 from the average to find the bulk of our agents range from 289 to 429 (rather than 321-397). By expanding with another 70 seconds, we are now at a range of 219 to 499. This second band includes 27% of our staff, and that wide range suggests a more widespread problem.

Some overall training program in the center might be needed to encourage adoption of the standard approach to this type of call. This will likely have the effect of lowering the overall AHT result!
Of course, there are many reasons why these AHTs vary so much and further analysis may help to narrow down the potential causes. Perhaps, looking only at the AHTs on individual days of the week or certain times of day will reveal some patterns to explore.
It is common to see higher AHTs on evenings and weekends, for example. This could be caused by a higher percentage of new hires in unattractive shifts, fewer supervisors during these periods, fewer resources to handle complex referral calls. Or it could just be that the callers save their most time-consuming calls for when they are off work. It has even been reported in some centers that calls are shorter during the day because agents don’t want the boss to hear them on personal calls.
Now, that you see how this kind of calculation might be useful, how is it done? The easiest way is with a spreadsheet tool. These are the steps:
- Enter all of the numbers to be analyzed in a column or row in the spreadsheet.
- Using the AVERAGE function, you can calculate the average or mean of this data. (This is not required to do standard deviation by will be helpful when understanding the results.)
- Choose any open cell and select the ‘standard deviation’ STDEV function. When you select this function, the system will ask you to highlight the group of numbers to be used in the calculation. You want to highlight all of the numbers in your analysis and click ENTER or OK.
- The standard deviation will appear in the open cell. (Note: There is also a calculation STDEVP, and this is rarely used in call center calculations as it requires that rather than a sample of data, you have the entire population of data. The results are slightly different from STDEV.)
If you really want to know how to do this manually with a calculator, you can search Excel help, Wikipedia or other sources for the details. I won't bore you with them in this article!
Standard deviation is a useful tool to apply to the plethora of data that you have in call centers. Averages alone never tell the whole story.
It is quite helpful in analyzing forecasting accuracy, schedule efficiency and intraday effectiveness. These are the standard measures of workforce management team performance. For these metrics, you will want to do your standard deviation calculation on the percentage of variance in your statistics rather than the specific count of differences (due to the changing workload). When used like this, it really doesn’t matter if it is a busy or slow time, the deviation pattern will emerge regardless. Using this single number, it is easier to track progress in managing these performance statistics.
Give it a try and you will likely find it is easy to do and a great help in managing your operation. And you will sound fabulous in meetings!
Did you find the article interesting and would like to share it with your colleagues? Download the article as a PDF.


